

Understanding the statistics used by casinos is essential in evaluating results. We use this to determine whether the results, bad or good, are a function of luck or skill. Here I will apply the statistical analysis to blackjack, but with minimal effort this can be applied to any casino game.
Blackjack does not adhere to the traditional mathematical laws of gaming. Most games of chance reflect the mathematical concept known as “the law of independent trials” that states that past events have no relevance on future events.
If a coin is flipped there is a 50% chance that the outcome would be heads and a 50% chance that the outcome would be tails. If the coin comes up 10 heads in a row the next flip would again have a 50% chance of coming up heads. In blackjack what happens in the past directly affects what happens in the future. Blackjack has memory, and the law of independent trials is not valid.
A Look at Advantages
In blackjack, each card has a specific value that it adds to, or subtracts from, the initial advantage that the casino has over the player. When enough of the right cards are dealt, the advantage swings in the players favor.
In blackjack when an ace or 10 value card is dealt the casino advantage over the player increases. When lower value cards are put in play the casino advantage decreases, and when enough of these cards are dealt, the player has an advantage over the casino.
When an abundance of high cards remains, the player has an advantage over the casino. This occurs for several reasons. First, blackjacks are dealt more frequently, and since the payoff on a blackjack is asymmetric (the player gets paid 3:2 on a player blackjack, but only loses his initial bet on a dealer blackjack), this benefits the player.
Secondly, some of the player options become more valuable, such as splitting and doubling down. Usually a player would like to see a high card come out when doubling down or splitting, or the player exercises these options when the dealer is weak and a high card is likely to break the dealer.
These plays have a higher return when the deck is rich in high cards. Finally, the player may vary his strategy depending upon the composition of the remaining cards. With a preponderance of high cards, the player can stand on more stiff hands (totals of 12-16), double down more often with strong totals or when the dealer is weak and susceptible to going over 21. In contrast, the rules prohibit the dealer from varying his strategy.

Inside the Numbers
A strategy that gives an advantage of 1% means that for every hand of blackjack that is played at $100, the Expected Value is $1. This is calculated by the expected value equation in equation 1.
EV = BET SIZE (X) % ADVANTAGE (X) # HANDS PLAYED
Equation 1
If we apply the expected value scenario to a flip of a coin we know that there are two sides to a coin so we have 50% chance of landing on heads and a 50% chance of landing on tails so the equation for how many heads we expect for 100 flips of a coin is in Equation 2. This is a single variable equation and the bet size can be set equal to 1.
EV= ½ (X) 100
Equation 2
When a coin is flipped 100 times the outcome is rarely exactly 50 heads and 50 tails. Therefore we must introduce the concept of variance per number of events. Variance is a measure of statistical dispersion. In layman’s terms, it deals with how far away from the expected value the result of a trial or experiment might be.
To stick with the coin flip example, variance helps answer the question of whether or not it would be surprising if we observed 45 heads out of 100 trials, or if we observed only five heads in 100 coin flips. The answers are no and yes. Getting only five heads in 100 coin flips would virtually prove you were flipping a weighted coin.
Understanding this concept is crucial since a proper statistical analysis is required in order to determine if the team’s results (good or bad) are a function of luck or skill.

A Look at Variance
Variance is usually discussed in terms of standard deviations, and that will be the case going forward in this discussion. Standard deviation is simply the square root of the variance. The standard deviation for a series of trials is given by Equation 3.
Std. Deviation = (Std. Deviation for a single event) X (Number of Events)^(1/2)
Equation 3
The following figure shows how likely results are to fall within one, two and three standard deviations of the expected result. In the graphical representation the expected value is indicated by the Greek letter MU and the Standard Deviation is represented by the Greek letter SIGMA.
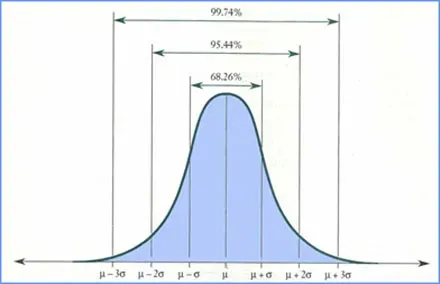
According to the Gaussian distribution curve, there is just over a 68% chance that the result will be within one standard deviation, plus or minus of the expected value. There is a just over a 95% chance that the results will be within two standard deviations, plus or minus of the expected value. There is approximately a 100% chance that the results will be within three standard deviations at any given time.
Applying this to the scenario of 100 flips of a coin we conclude that the standard deviation for 100 trials is 10 times the standard deviation for a single trial (which is 0.5), which yields a standard deviation of 5 for the 100 trial experiment.
In the coin flip scenario we expect the 50 of the 100 flips to land on heads and 50 of the 100 to land on tails. Including the standard deviation concept of plus or minus 5, there is a 68% chance that for a 100 flips of a coin the coin will land somewhere between 45 and 55 heads and the balance tails.
Applying the expected value and standard deviation equations to the betting unit of 100 dollars with a 1% total advantage the following results are computed.
| # of Hands | Expected Value | Standard Deviation |
| 100 | 100 | +or- 1,100 |
| 10,000 | 10,000 | +or- 11,000 |
| 1,000,000 | 1,000,000 | +or- 110,000 |
Graphically it is represented as follows.
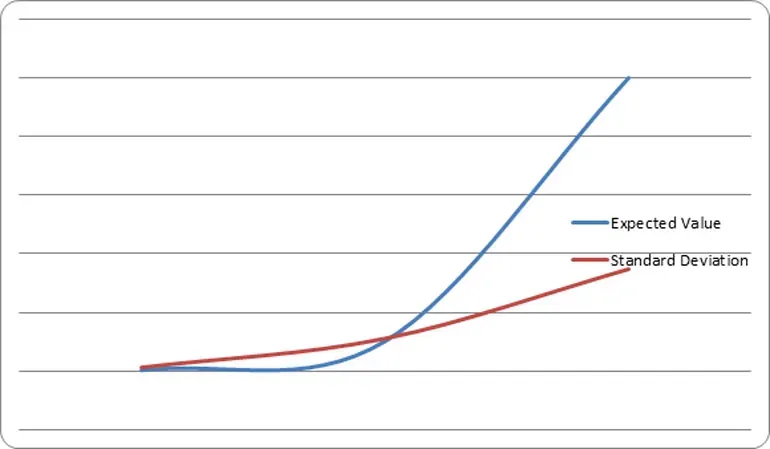
As the number of events increases, the standard deviation gets smaller and smaller relative to the expected value. At some point along the curve the expected value and standard deviations intersect.
At this point there is an 84% chance that the standard deviation will be less than the expected value. This gives an 84% chance that a profit will be made. When the number of events increases beyond that point the percentage increases logarithmically. This is pictorially shown in the following graph.

FOR SIMPLICITY THE STANDARD DEVIATION VALUE IS ABSOLUTE
The intersect point between the expected value and standard deviation is just below 12,000 hands. At 12,000 hands there is an 84% chance that the expected value will surpass the negative standard deviation, indicating a positive EV 84% of the time.
When the overall advantage is increased the “equivalence” point, or the number of hands at which the expected value equals the standard deviation, is reached in fewer hands. Computing the same graph with 2% advantage the graph shows an equivalence point of 5,600 hands.
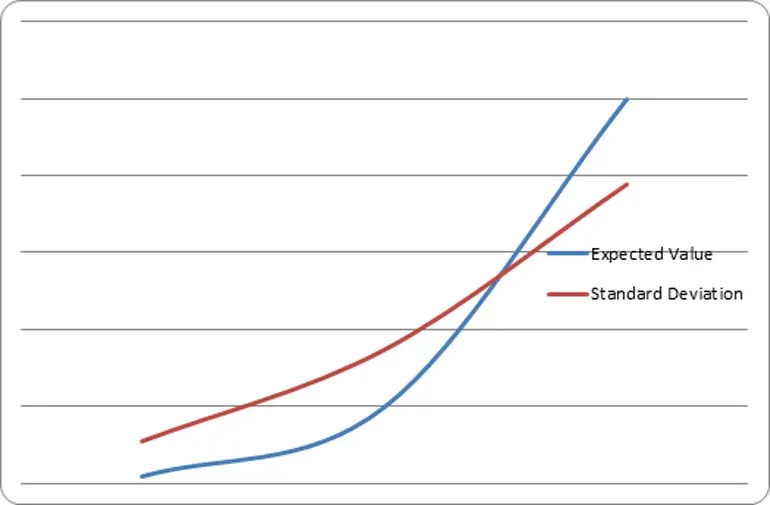
FOR SIMPLICITY THE STANDARD DEVIATION VALUE IS ABSOLUTE
Adding to an Advantage
The most effective way to increase an advantage is to have a high betting spread. In an ideal scenario a player bets a lot when there is an advantage and nothing when there is no advantage.
Imagine a game where when a coin is flipped and when it lands on heads the person gets paid 2 units and when the coin lands on tails the person has to pay 1 unit. Would you play that game? Most people would say yes.
However, you have to make sure that you have enough units to overcome any negative swings that you may encounter. If a person only had 4 units to wager it is possible that the coin could land on tails 4 times in a row and the person would have lost all their funds. However, if a person had 100 units they would have enough funds to outlast the negative swings of the game, and there is a very good chance that game would be profitable to the player.
In casino gaming, enough funds are required to outlast any negative swings that may occur. In general the more funds you have the better chance of success you have. This is why casinos often outlast players because the player is never able to get the long run and overcome the statistical speed bumps that occur.
